Everyday use
What every number on your dashboard means
A number is only useful if you know what it leaves out. Every figure on the dashboard has an (i) beside it, and this guide puts them in order.
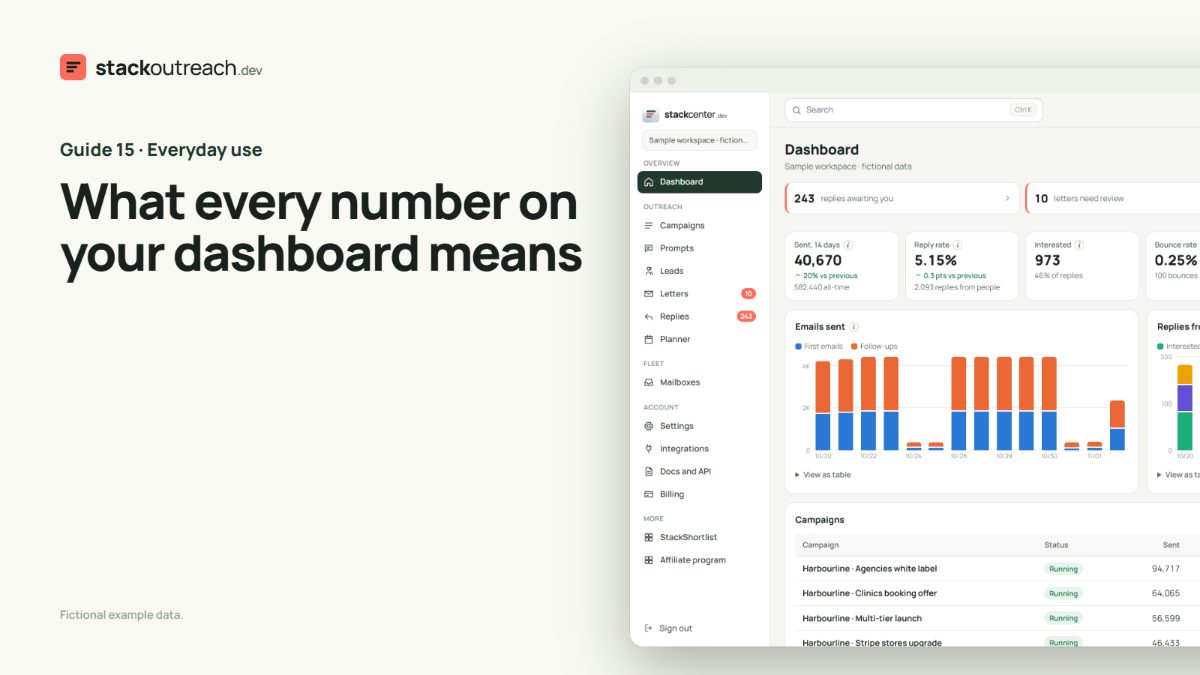
Sends and capacity
Sent is what left in the period, with the previous period beside it. Capacity is what today's mailboxes could send. If sends sit well under capacity, you are short of leads or your send windows are narrow, not short of mailboxes.
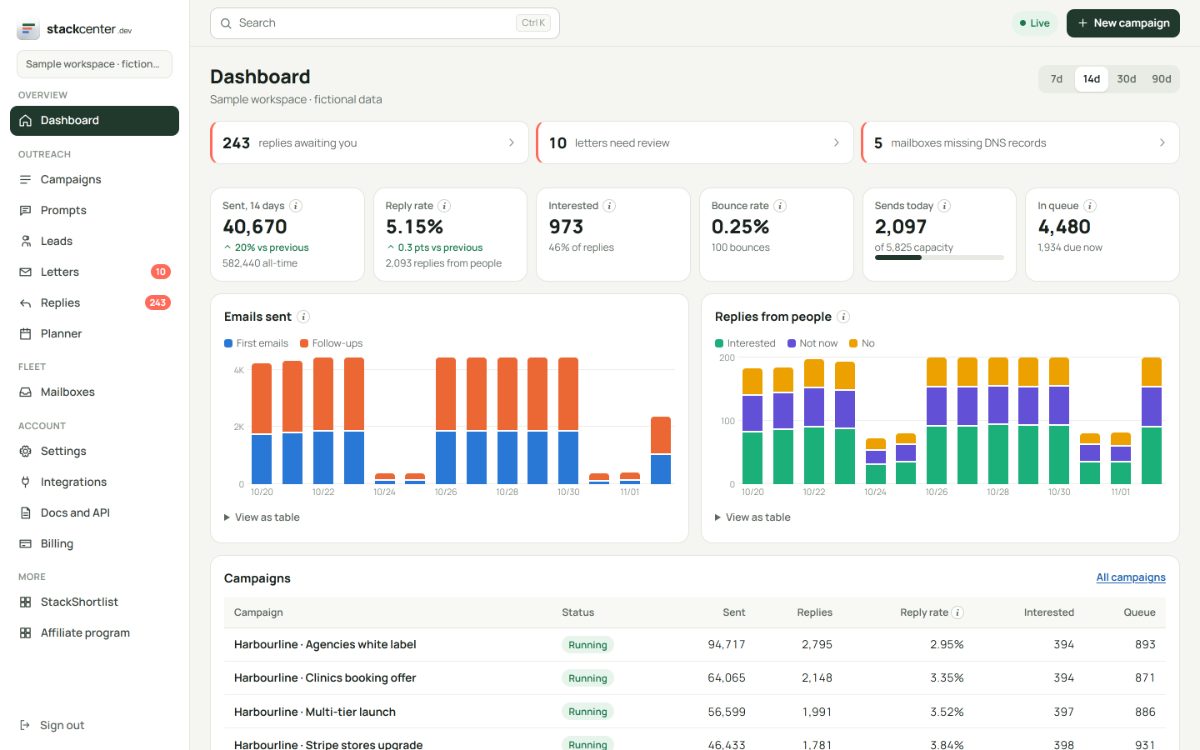
Replies from people
This count leaves out out-of-office and bounces, because neither is a person answering you. Reply rate is that count divided by sends. Interested is the share of those replies that want to talk.
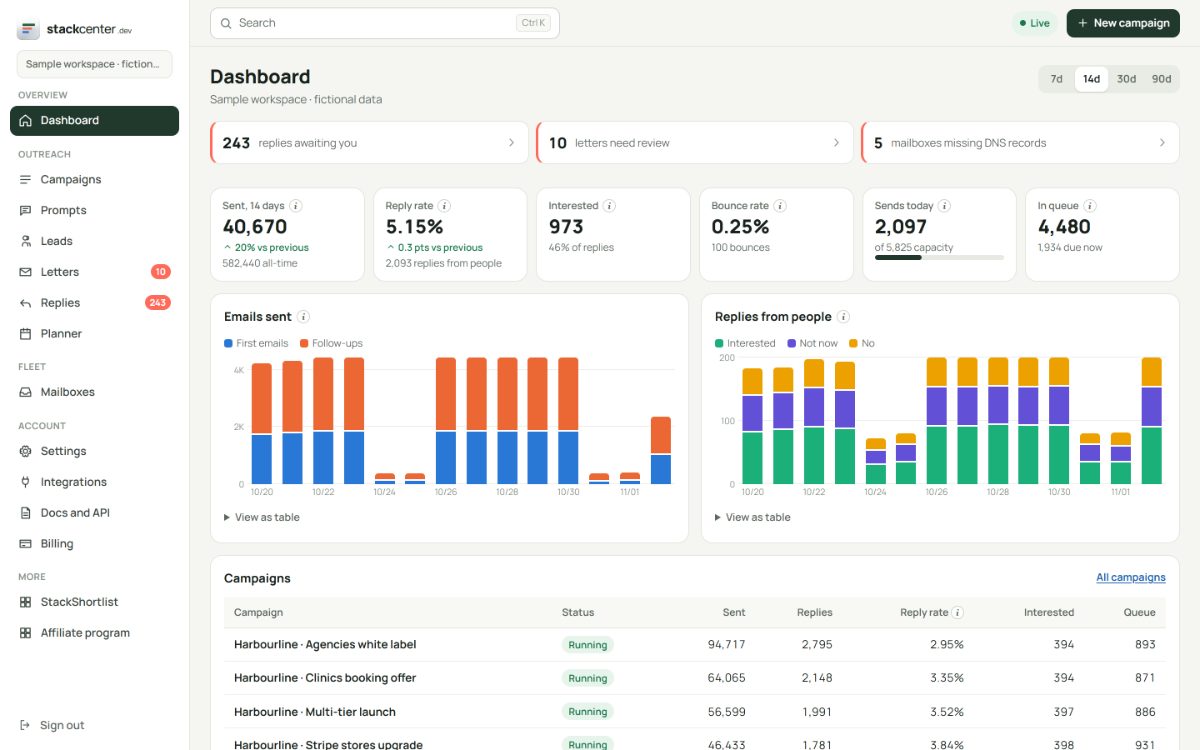
When replies arrive
The grid shows replies by weekday and hour. Use it to set send windows, and to know when to be at your desk.
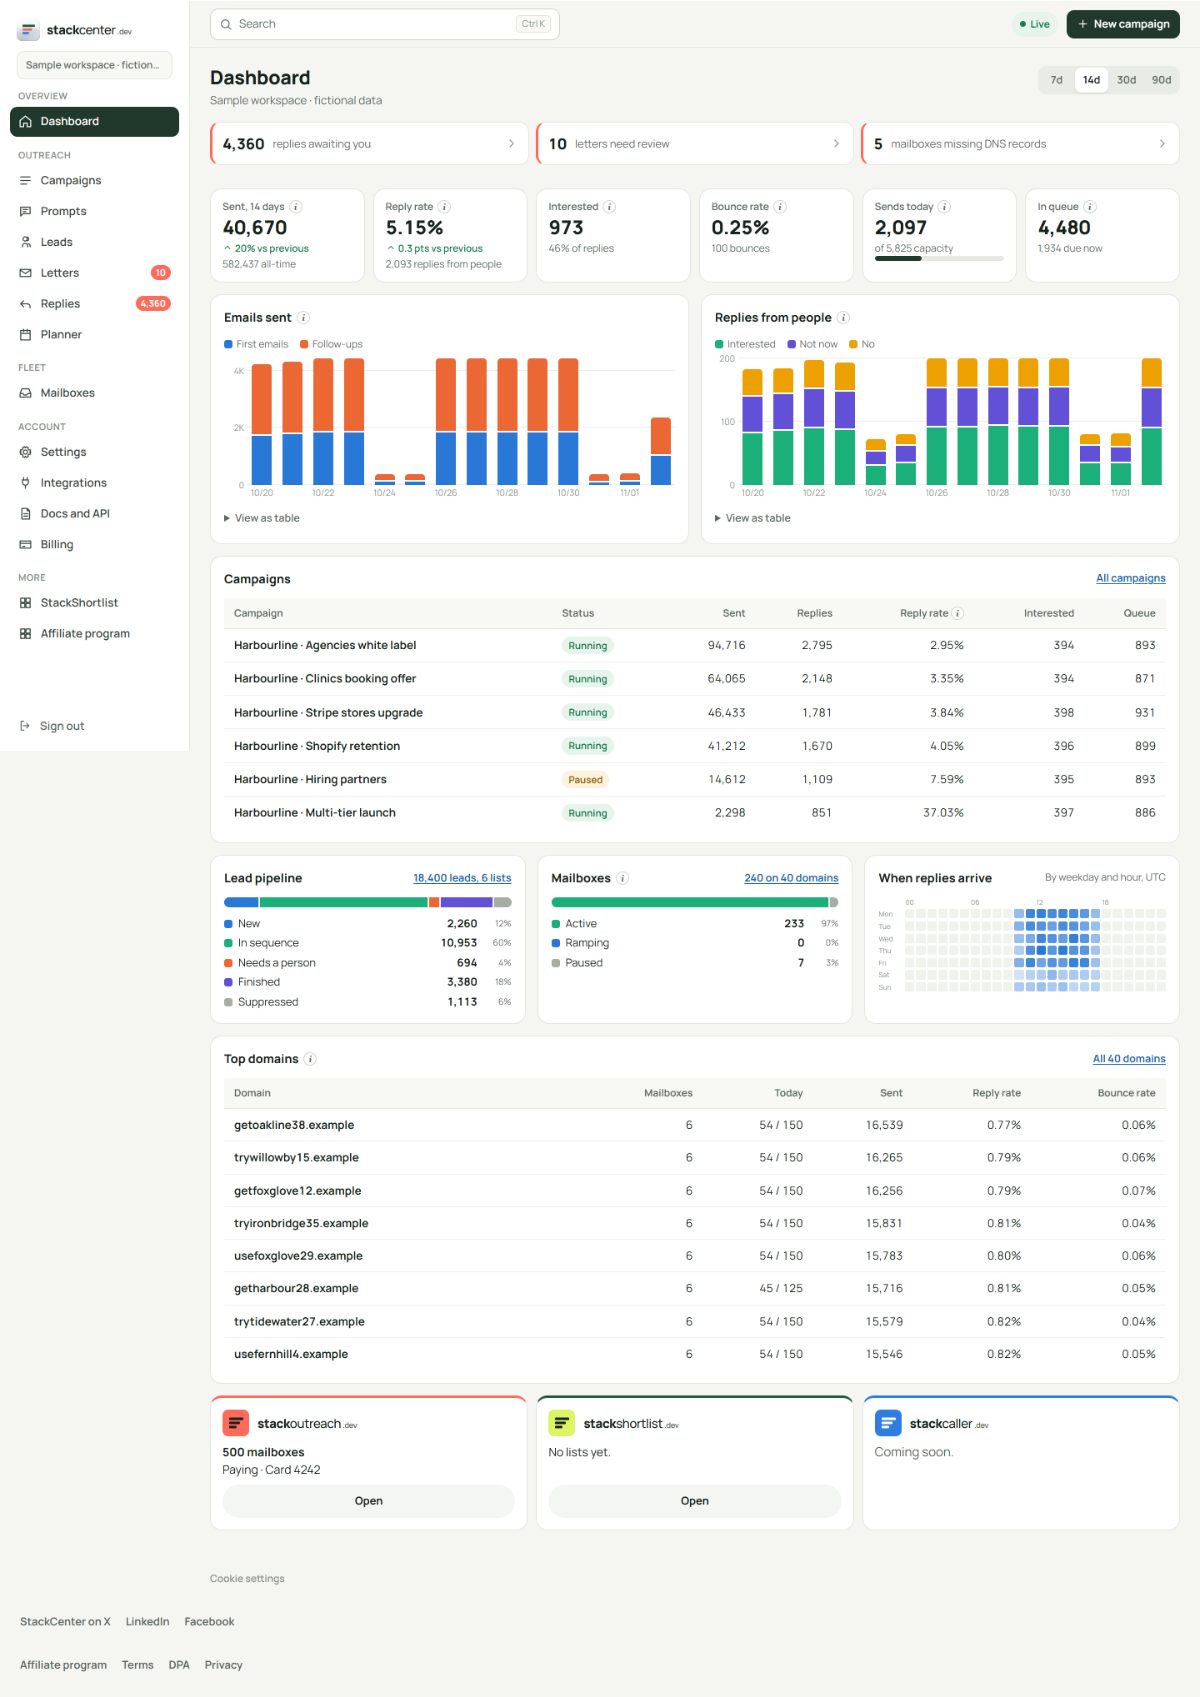
Your checklist
- Read interested before reply rate.
- Compare to the last period, not to a target.
- Check the lead pipeline for what runs out next.
- Use the tables view when you need exact numbers.
Screens show a fictional workspace with example data.